| jmeter sampler for rstatd. |
| overview installation how to use versions developer |
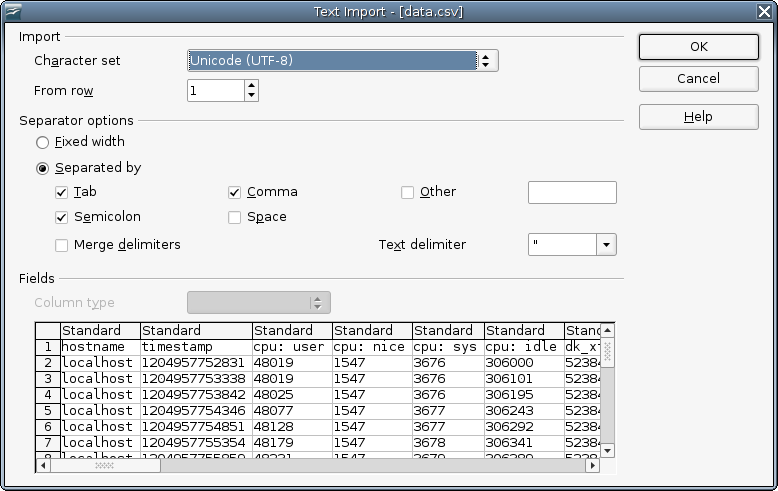
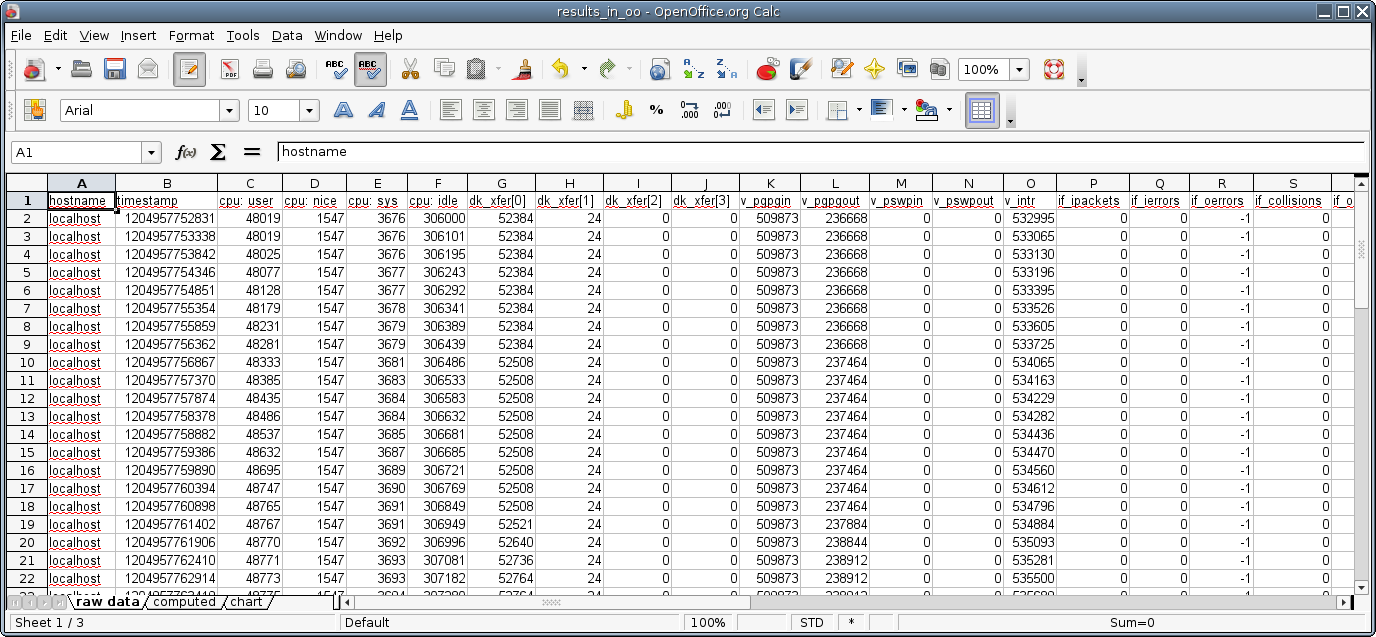
how to use. sampler in jmeter cpu usage as chart (open office document) sampler in jmeter start jmeter create new "Test Plan", add "Thread Group" and set "Loop Count" to 50, add "rstatd: sampler" and set address of "server" and "output format" to "object", add "Constant Timer" and set "Thread delay" to 1000 miliseconds (1 second), add "rstatd: text visualizer". don't forget to save the test plan :-) start "Test Plan" and watch results in rstatd: text visualizer. cpu usage as chart (open office document) create new "Test Plan" add "Thread Group" and set "Loop Count" to 50, add "rstatd: sampler" and the server and "output format" to "object", add "Constant Timer" and set it to 500 miliseconds, add "rstatd: results writer" and select a file (ex. "data") in format "csv". start "Test Plan" and wait for end of it. start calc from open office. open the saved result (csv file), on text import select "Comma". save document as oo-document. rename the sheet with data to "raw data". add two new sheets named "computed" and "chart". screenshots: import dialog, preparated document. on sheet "computed": cells in column A referenced cells from column B from sheet "raw data" (ex. A2=='raw data'.B3) cells in column C..F saves difference between two cells with cpu usage (ex. C2 = 'raw data'.C3-'raw data'.C2) cells in column B are sum of cells C..F (ex. B2 = SUM(C2:F2)) cells in column G..J saves cpu usage in percent (ex. G2 = (C2 * 100) / $B2) cells in column K are sum of cells G..J (ex. K2 = SUM(G2:J2)). it must be 100.00% ;-) screenshot: sheet "computed". on sheet "chart": add a chart (menu: "Insert" -> "Chart", select chart type: "Line" -> "Lines Only"). add data ranges to chart (right mouse button -> "Data Ranges..."): on tab "Data Range" select timestamps from sheet "computed" (Data range=$computed.$A$2:$A$50) on tab "Data Series" press button "add", as "Range for name" select "$computed.$G$1", as "Range for Y-Values" select "$computed.$G$2:$G$50". screenshot: sheet "chart". example document. |
| thanks to: |